
Financial Saving
9 November, 2015
| SUMMARY |
|---|
| There is a declining trend seen in savings which depicts a negative sign for the economy, leading to increase in current account deficit and a call for increased investment.
The savings rate dipped to the lowest in the past nine years and has accentuated the macroeconomic imbalances. Indian household is saving less as well as borrowing. For GDP to increase more economic activity coupled with investment is required. The government has already taken measures in Budget 2014. The table summarizes the Financial Savings as a % of GDP in past 9 years (2007-2015). Savings in Financial Assets (bank deposits, insurance, mutual funds, bonds and stocks) contributed minimal in GDP in 2011-2012 whereas, savings in Financial Liabilities (Loans) contributed minimal in 2008-2009. There has been a major decline in Mutual Fund investment of 38% in 2014-2015 as compared to 2013-2014. Contribution of household savings in non financial assets (gold, real estate) has fallen by -0.5% between 14-15 and 15-16. In Financial Assets, people prefer keeping money in bank. Investing in provident fund, and pension plans, has contributed as a major savings avenue for long term savings, mainly because of the organised sector savings. PPF is preferred over Life Insurance and Pension Plans. Gold & Real Estate form a part of Physical savings. We can see that, in 2011-12 there was a high investment in the physical savings (more in real estate than gold) in India. Contribution of Savings by private corporate sector is 3 to 5 times more than that by public sector in GDP. As compared to 2007, there has been a decline in savings in household sector. Year on year we can see a very slow growth in savings. Due to inflation in the economy, people have less disposable income since price of goods and services have increased. This leads to low savings potential. The data for 2015-2016 is estimated data. It has been predicted that year 2015-16 would be similar to 2014-2015. The growth will be slow but constant. There will be an increase in savings in financial assets from the Mutual Fund sector estimating a growth of 139%. Bank deposits have the largest share, and contribute a major component in household savings. Real Estate would see a downfall thus, lowering savings in this sector. There has been an estimation of overall decline in GDP of India due to decline in exports majorly in merchandise exports and service exports which was even noticed in Q2 2015. To promote savings in household sector which forms a major component of GDP of a country RBI should come up with schemes which promotes people to invest in private corporate sector, bank deposits etc., encourage more retail participation through introduction of schemes like Jeevan Yogna and other such mass saving savings schemes for the small investor. Borrowings from banks, can be increased by making people aware of different investment avenues and relaxation in redtapism which will promote and help in economic development. This will in turn also increase public and private corporate sector investment, leading to improved economic situation in our country. Credits : Divya Agarwal |
| Layout |
| COMPONENTS | 2007-08 | 2008-09 | 2009-10 | 2010-11 | 2011-12 | 2012–13 | 2013-14 | 2014-15 | 2015-16 | DIFFERENCE 14-15/ 15-16 | SOURCE |
|---|---|---|---|---|---|---|---|---|---|---|---|
| Gross Savings in Financial Assets (% of GDP) | 15.4 | 13.0 | 15.1 | 13.9 | 11.1 | 12.4 | 13.8 | 15.0 | 16.1 | 1.1 | https://data.gov.in/catalog/domestic-savings-and-components-thereof-proportion-gdp-current-prices |
| Financial Liabilities (% of GDP) | 3.8 | 2.9 | 3.1 | 3.6 | 3.1 | 3.4 | 3.8 | 4.2 | 4.5 | 0.3 | https://data.gov.in/catalog/domestic-savings-and-components-thereof-proportion-gdp-current-prices |
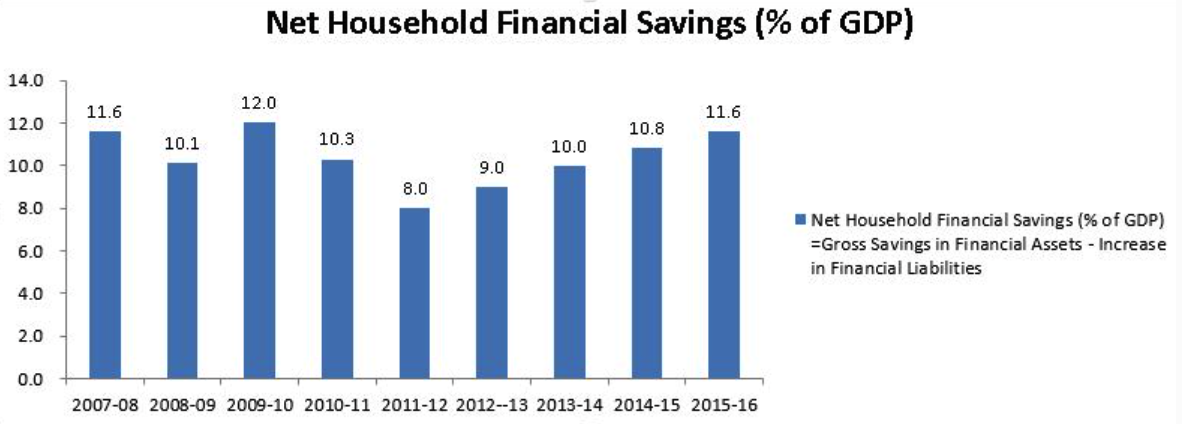
| Net Household Financial Savings (% of GDP) =Gross Savings in Financial Assets – Increase in Financial Liabilities |
11.6 | 10.1 | 12.0 | 10.3 | 8.0 | 9.0 | 10.0 | 10.8 | 11.6 | 0.8 | |
| Household saving in physical assets (Gold & Real Estate) (% of GDP) | 10.5 | 13.5 | 13.2 | 13.4 | 14.3 | 13.2 | 12.7 | 12.2 | 11.7 | -0.5 | https://data.gov.in/catalog/domestic-savings-and-components-thereof-proportion-gdp-current-prices |
| Total Net Household savings (Financial +Physical) (% of GDP) =Net Household Financial Savings + Household saving in physical assets |
22.1 | 23.6 | 25.2 | 23.7 | 22.3 | 22.2 | 22.7 | 23.0 | 23.3 | 0.3 | |
| Savings by the private corporate sector (% of GDP) | 9.4 | 7.4 | 8.4 | 7.9 | 7.2 | 7.3 | 7.7 | 8.0 | 8.5 | 0.5 | https://data.gov.in/catalog/domestic-savings-and-components-thereof-proportion-gdp-current-prices |
| Savings by the public sector (% of GDP) | 5.0 | 1.0 | 0.2 | 2.6 | 1.3 | 1.5 | 2.0 | 2.5 | 3.1 | 0.6 | https://data.gov.in/catalog/domestic-savings-and-components-thereof-proportion-gdp-current-prices |
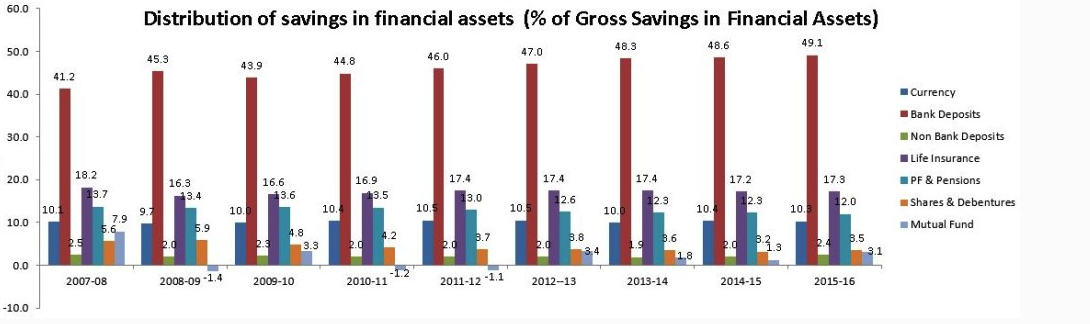
| Distribution of savings in financial assets (% of Gross Savings in Financial Assets) | Currency: 10.1 Bank Deposits: 41.2 Non Bank Deposits: 2.5 Life Insurance: 18.2 PF & Pensions: 13.7 Shares & Debentures: 5.6 Mutual Fund: 7.9 |
Currency: 9.7 Bank Deposits: 45.3 Non Bank Deposits: 2.0 Life Insurance: 16.3 PF & Pensions: 13.4 Shares & Debentures: 5.9 Mutual Fund: -1.4 |
Currency: 10 Bank Deposits: 43.9 Non Bank Deposits: 2.3 Life Insurance: 16.6 PF & Pensions: 13.6 Shares & Debentures: 4.8 Mutual Fund: 3.3 |
Currency: 10.4 Bank Deposits: 44.8 Non Bank Deposits: 2.0 Life Insurance: 16.9 PF & Pensions: 13.5 Shares & Debentures: 4.2 Mutual Fund : -1.2 |
Currency: 10.5 Bank Deposits: 46.0 Non Bank Deposits: 2.0 Life Insurance: 17.4 PF & Pensions: 13.0 Shares & Debentures: 3.7 Mutual Fund: -1.1 |
Currency: 10.5 Bank Deposits: 47.0 Non Bank Deposits: 2.0 Life Insurance: 17.4 PF & Pensions: 12.6 Shares & Debentures: 3.8 Mutual Fund: 3.4 |
Currency: 10.4 Bank Deposits: 48.3 Non Bank Deposits: 1.9 Life Insurance: 17.4 PF & Pensions: 12.3 Shares & Debentures: 3.6 Mutual Fund: 1.8 |
Currency: 10.4 Bank Deposits: 48.6 Non Bank Deposits: 2.0 Life Insurance: 17.2 PF & Pensions: 12.3 Shares & Debentures: 3.2 Mutual Fund : 1.3 |
Currency: 10.5 Bank Deposits: 49.1 Non Bank Deposits: 2.4 Life Insurance: 17.3 PF & Pensions: 12.0 Shares & Debentures: 3.5 Mutual Fund: 3.1 |
Currency: 0.1 Bank Deposits: 0.5 Non Bank Deposits: 0.4 Life Insurance: 0.1 PF & Pensions: -0.3 Shares & Debentures: 0.3 Mutual Fund: 1.8 |
Non Bank Deposit includes UTI, Post Office Fund. http://www.dnb.co.in/BFSI2012/PDF/Mutual_Funds.pdf http://www.livemint.com/Money/PMP0KTB4R8qvV0S1hulj0K/Household-gross-financial-savings-as-percentage-of-GDP-lowes.html |
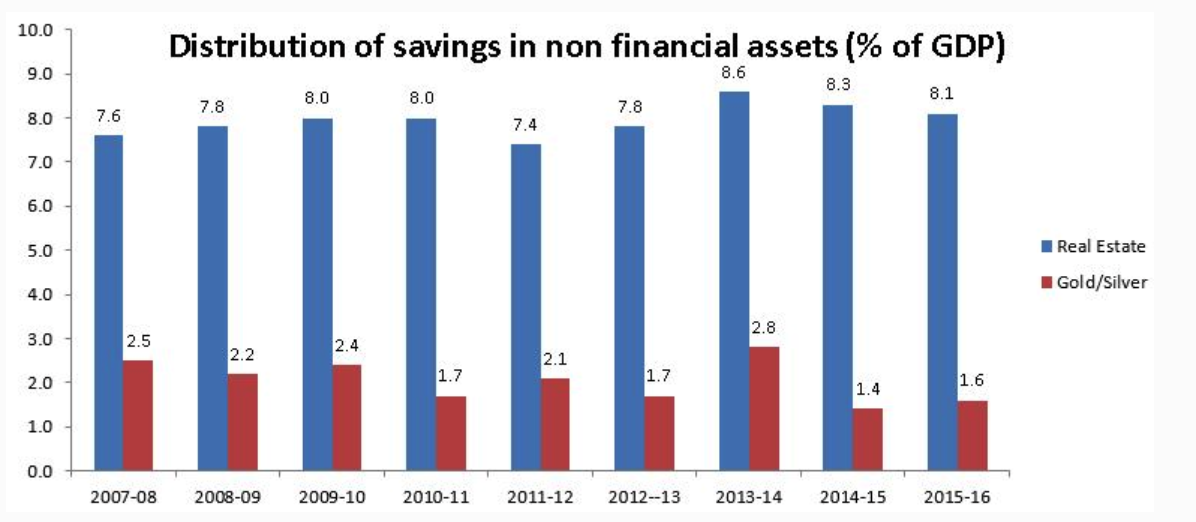
| Distribution of savings in non financial assets (% of GDP) | Real Estate: 7.6 Gold/Silver: 2.5 |
Real Estate : 7.8 Gold/Silver : 2.2 |
Real Estate: 8.0 Gold/Silver: 2.4 |
Real Estate : 8.0 Gold/Silver : 1.7 |
Real Estate: 7.4 Gold/Silver: 2.1 |
Real Estate : 7.8 Gold/Silver: 1.7 |
Real Estate : 8.6 Gold/Silver : 2.8 |
Real Estate : 8.3 Gold/Silver : 1.4 |
Real Estate : 8.1 Gold/Silver : 1.6 |
Real Estate : -0.2 Gold/Silver : 0.2 |
https://www.rbi.org.in/ |
| Common Saving Avenues (Amount in Crores) | PF & Pensions: 70,878 Bank Deposit: 4,15,245 MF: 56,799 Insurance: 1,24,422 |
PF & Pensions : 70,891 Bank Deposit: 4,36,710 MF : -10,478 Insurance: 1,45,876 |
PF & Pensions : 1,29,850 Bank Deposit: 4,67,575 MF: 33,040 Insurance: 2,58,920 |
PF & Pensions: 1,38,970 Bank Deposit : 5,24,800 MF : -11,560 Insurance: 2,20,730 |
PF & Pensions: 94,900 Bank Deposit: 5,44,500 MF : -10,620 Insurance : 2,23,430 |
PF & Pensions : 1,22,300 Bank Deposit: 5,90,600 MF: 35,000 Insurance : 1,80,300 |
PF & Pensions: 1,35,900 Bank Deposit: 6,90,800 MF : 21,000 Insurance: 1,99,600 |
PF & Pensions : 1,33,400 Bank Deposit : 7,25,480 MF: 13,020 Insurance: 1,85,257 |
PF & Pensions: 1,25,780 Bank Deposit: 7,50,000 MF : 31,240 Insurance: 1,82,294 |
PF & Pensions : -7,620 Bank Deposit: 24,520 MF : 18,220 Insurance: -2,963 |
https://www.rbi.org.in/ |
| Common Saving Avenue (%) (% of GDP) | PF & Pensions : 13.7 Bank Deposit: 41.2 MF: 7.9 Insurance: 17.4 |
PF & Pensions: 13.4 Bank Deposit: 45.3 MF: -1.4 Insurance: 19.5 |
PF & Pensions: 13.6 Bank Deposit: 43.9 MF: 3.3 Insurance: 16.6 |
PF & Pensions: 13.5 Bank Deposit: 44.8 MF: -1.2 Insurance: 16.9 |
PF & Pensions: 13.0 Bank Deposit: 46.0 MF: -1.1 Insurance: 17.4 |
PF & Pensions: 12.6 Bank Deposit: 47.0 MF: 3.4 Insurance: 17.4 |
PF & Pensions: 12.3 Bank Deposit: 48.3 MF: 1.8 Insurance: 17.4 |
PF & Pensions: 12.3 Bank Deposit: 48.6 MF: 1.3 Insurance: 17.2 |
PF & Pensions: 12.0 Bank Deposit: 49.1 MF: 3.1 Insurance: 17.3 |
PF & Pensions: -0.3 Bank Deposit: 0.5 MF: 1.8 Insurance: 0.1 |
https://www.rbi.org.in/ |
| Gross Domestic Savings (% of GDP) =Total Net Household savings (Financial +Physical) + Savings by the private corporate sector + Savings by the public sector |
36.5 | 32.0 | 33.8 | 34.2 | 30.8 | 31.0 | 32.4 | 33.5 | 34.9 | 1.4 | |
| GDP Of India (% growth) | 9.8 | 3.9 | 8.5 | 10.3 | 6.6 | 5.1 | 6.9 | 7.4 | 7.0 | -0.4 |
|
Net Household saving |
| COMPONENTS | 2007-08 | 2008-09 | 2009-10 | 2010-11 | 2011-12 | 2012–13 | 2013-14 | 2014-15 | 2015-16 |
|---|---|---|---|---|---|---|---|---|---|
| Net Household Financial Savings (% of GDP) =Gross Savings in Financial Assets – Increase in Financial Liabilities |
11.6 | 10.1 | 12.0 | 10.3 | 8.0 | 9.0 | 10.0 | 10.8 | 11.6 |
| COMPONENTS | 2007-08 | 2008-09 | 2009-10 | 2010-11 | 2011-12 | 2012–13 | 2013-14 | 2014-15 | 2015-16 |
|---|---|---|---|---|---|---|---|---|---|
| Currency | 10.1 | 9.7 | 10.0 | 10.4 | 10.5 | 10.5 | 10.0 | 10.4 | 10.3 |
| Bank Deposits | 41.2 | 45.3 | 43.9 | 44.8 | 46.0 | 47.0 | 48.3 | 48.6 | 49.1 |
| Non Bank Deposits | 2.5 | 2.0 | 2.3 | 2.0 | 2.0 | 2.0 | 1.9 | 2.0 | 2.4 |
| Life Insurance | 18.2 | 16.3 | 16.6 | 16.9 | 17.4 | 17.4 | 17.4 | 17.2 | 17.3 |
| PF & Pensions | 13.7 | 13.4 | 13.6 | 13.5 | 13.0 | 12.6 | 12.3 | 12.3 | 12.0 |
| Shares & Debentures | 5.6 | 5.9 | 4.8 | 4.2 | 3.7 | 3.8 | 3.6 | 3.2 | 3.5 |
| Mutual Fund | 7.9 | -1.4 | 3.3 | -1.2 | -1.1 | 3.4 | 1.8 | 1.3 | 3.1 |
| Savings in financial assets |
| Savings in non financial assets |
| COMPONENTS | 2007-08 | 2008-09 | 2009-10 | 2010-11 | 2011-12 | 2012–13 | 2013-14 | 2014-15 | 2015-16 |
|---|---|---|---|---|---|---|---|---|---|
| Real Estate | 7.6 | 7.8 | 8.0 | 8.0 | 7.4 | 7.8 | 8.6 | 8.3 | 8.1 |
| Gold/Silver | 2.5 | 2.2 | 2.4 | 1.7 | 2.1 | 1.7 | 2.8 | 1.4 | 1.6 |
 |
| Assumption |
| SR. NO. | DETAIL |
|---|---|
| 1 | Net Household Financial Savings = Gross Savings in Financial Assets – Increase in Financial Liabilities. |
| 2 | Total Net Household savings (Financial +Physical) = Net Household Financial Savings + Household saving in physical assets. |
| 3 | Gross Domestic Savings = Total Net Household savings (Financial +Physical) + Savings by the private corporate sector + Savings by the public sector. |
| 4 | Financial Liabilities will be advances from bank, loans. |
| 5 | Household savings in physical asset will be gold, real estate. |
| 6 | Amount taken as current price. |
| 7 | 2015-2016 data is estimated. |
| Source |